
It is already 2021 and 2020 is finally (or not) over. It has become a good tradition to look back on the year that’s passed and provide you with annual spam filtering stats. Let’s have a quick look on the spam filtering statistics. Here is the diagram that shows visualization of different types of messages:
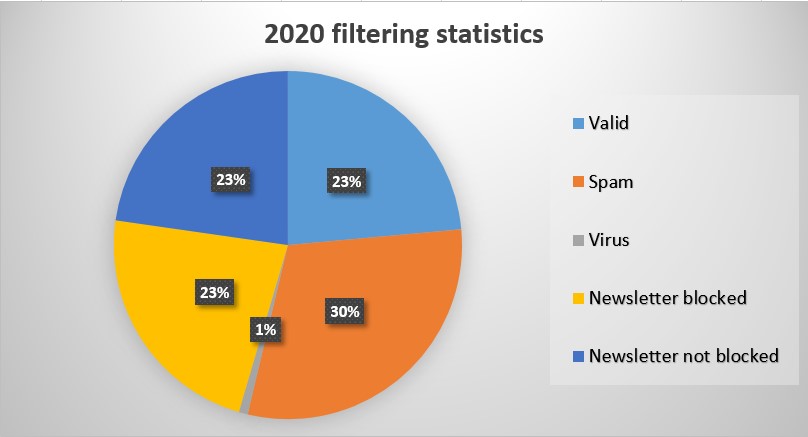
As you can see, this chart shows that all the messages types have almost the same percentage. Only the virus percentage is on a very low level and we think it is not that bad. Here is the detailed overview (M – millions of messages):
- Valid: 57 M
- Spam: 73 M
- Virus: 0,3 M
- Newsletters blocked: 55 M
- Newsletters not blocked: 55 M
Please feel free to check the statistics of your personal account here. We hope you might find it interesting to see the recent stats of your own account.
We hope next year we will filter even more messages (and less spam messages of course).
Thanks for reading!